Monday 30 September 2013

Using VMware I/O Analyser To Test Storage Performance

Today i've been experimenting with the VMware I/O Analyser as a useful tool to drive storage performance from a fairly even baseline of tests.

The tool essentially is an Ubuntu VM with IOMeter and a web front end (which is OK, but doesn't help much), wrapped up in a nice OVF package.

First step is to download the package, which is available from the VMware Flings website (http://labs.vmware.com/flings/io-analyzer).

Next we need to push the OVF into the environment. As this is the controller VM we are not wanting to monitor the backend performance stats of the VM itself, so it should NOT be published on the datastore that we wish to test. Instead, publish the VM onto a local datastore or another shared volume. This is mostly due to the workload being generated may saturate the disks, SAN controllers or network which could affect this VM and may be detrimental to your test and not provide a fair result. 

In my case "Nimble-IOAnalyser" was my local datastore, and VMFS-01 was my datastore to be tested:


Select a datastore which is NOT to be tested by the I/O Analyser for your OVF deployment.
VMware's best practice for deploying Virtual Machines is to deploy the disks using "Thick Provision, Eager Zero" as a profile, so go ahead and use that.


Once the VM has been deployed it's key to take a look at the settings and at the disks it's created. What you'll notice is that the test disk (Hard Disk 2) has been created with only 100MB as a size; which means 100% of the testing will reside in memory or in controller cache. This is something we need to avoid as it does not provide a fair and real-world result. This Hard Disk is also provisioned into the incorrect datastore by default.


The default testing drive needs to be deleted (Hard Disk 2)
Delete this disk and create a new one with at least 100GB as it's size. This disk should also be placed on the datastore for which you wish to test the performance of, and again use "Thick Provision, Eager Zero".


Once deployed, power the VM on. You should be greeted with the familiar VMware appliance screen. Change your timezone to what's relevant to you (GMT for me). You could also change the network settings here, but I left mine as DHCP as it's not really needed. Login to the VM with the default credentials of root/vmware to continue.

Note: we're not going to use the web client provided for this tool, as whilst it's ok it's not possible to change any of the default values in the I/O testing phase of this workload.


Once logged in you'll see an Ubuntu screen with a terminal window open. Right-Click on the desktop and open another (Terminals->xterm).

In the first terminal, you want to type "/usr/bin/dynamo". This starts the backend IOMeter worker and thread engine.

In the second window, type "wine /usr/bin/Iometer.exe". This will open the IOMeter application, and should tie into the dynamo engine started.

Note: ignore the comment underneath of "Fail to open kstat...", as long as you opened the engine before IOMeter it'll be OK.


From here onwards it's down to how you use IOMeter. There are lots of incorrect methods to using this tool to provide expected results, so here are my settings:

  • Two workers, both mapped to the new 100GB volume (sdb).
  • Maximum disk size of 200000000 sectors (translates to 95GB).
  • 32 Outstanding I/Os per target (if this is left to 1 the test is not adequately driving the storage array!).


  • A new workload policy is created for 4K blocks. 100% random workload, and 100% write. (100% write should ALWAYS be the very first workload to the volume, otherwise there is no data to actually read back which does not provide real-world results).
  • Align the I/Os to the block size of your volume to remove disk misalignment performance discrepancies. In my case it's 4K.
  • Assign this workload to each of your workers to ensure you're consistent with your tests.
Some people may ask why 100% random; if you wish to test for IOPS performance in your storage, random IO is the key to generate these statistics. If you wish to test network performance (rather than IOPS) then Sequential I/O should be used. You should NOT mix these workloads together as you will be given inconsistent and inconclusive results for both disk and network stats.


  • Before running the test ensure you set a ramp up period (I use 15 seconds) and set a standard run-time (I use 10 minutes). Ensure all your workers are selected.
  • Click the Green Flag to start the test!
I hope the above has been useful to you. Please feel free to run this test and let me know your stats in the comments box on this page, along with the make/model of your storage array - would be a fun survey!

PS - if you wish to see my results:


Wednesday 25 September 2013

Nimble Storage 2.0 Part 1 - Scale-To-Fit

This is the first in a series of blog posts focusing on the new Nimble OS 2.0 which has been made available in Release Candidate status to our customer & partner base.

Nimble Storage has hit a milestone in it's product development and feature set by hitting 2.0 of it's awarding winning Operating System based on the CASL file system (Cache Accelerated Sequential Layout). 2.0 introduces some nice features which i'll cover over a series of blog posts in the following weeks.

Scale-To-Fit - Nimble OS 1.4

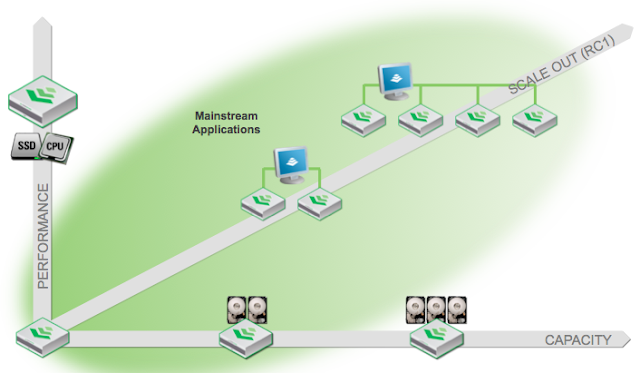
Approximately 12-14 months ago Nimble launched a concept of "Scale-To-Fit" storage technology. The idea being that traditional storage systems had limited ways for expansion once the customer had deployed the environment; these typically being:
  1. Add lots more slow disk for capacity or fast disk for performance (very common, not much risk involved).
  2. Forklift replace controller headers for new generation controllers to allow for further disk expansion (very expensive, high risk due to potential data downtime or loss, lots of Professional Services involved, rarely done).


Scale-To-Fit was designed to break this mould and give the customer a choice in how to upgrade their investment as their environment evolves. This was released in firmware version 1.4 of the Nimble OS, and allowed any Nimble customer to do the following:


  1. Add additional shelves of high-capacity drives for extra storage capacity.
  2. Add bigger SSD drives into the array to allow for bigger working sets for random-read cache.
  3. Upgrade Nimble controllers from CS200 to CS400 series to add more IOPS in the array.

All of the above upgrades were (and still are) designed to be performed online, without any maintenance windows or downtime of data - and it worked without any hiccups, which is very impressive (especially number 2 & 3 - see here for how our very first production customer with a 3 year old system did it this year: http://www.nimblestorage.com/blog/customers/non-disruptive-upgrade-to-nimble-storages-first-deployed-array/).

So what does 2.0 bring to Scale-To-Fit?

In Nimble OS 2.0 we complete the Scale-to-Fit strategy by bringing Scale-Out technology into the Nimble family!


Scale-Out is a technology which was mostly championed by EqualLogic (now Dell, my former employers) and Lefthand Networks (now HP) and is designed to allow customers to place multiple arrays into a "group" which allows volumes and/or datasets to be distributed, balanced and "live migrated" across different storage platforms without downtime. 

The downside to the two legacy technologies mentioned above was that scale-out is/was their only way of scaling. If a customer required just more capacity for their investment they had to buy a whole new array with controllers, networking and rack space just for a few more additional TB's of space - and these boxes were typically more expensive than their initial purchase due to less aggressive discounts offered (the age old sales ploy of discount high to win business then discount low to increase margin - seen it time and time again). One of my old EQL customers ended up with TWENTY THREE 3 or 5u arrays in their production site!

What Nimble offers is a full suite of scaling technologies without any gotchas; so if a customer just needs capacity they can buy additional shelves, but if they want to Scale-Out to group performance and capacity of their arrays together, they can do that too! All of this can be done live, without any downtime or any professional services work! Nice!

The beauty about scale-out is it does not limit customers to generations of gear; meaning that older arrays can be grouped together with newer, faster generations for seamless migration of data before evacuating the older array to repurpose for UAT, Disaster Recovery or other means (as one example).

On first release we are supporting up to FOUR Nimble arrays in a scale-out group. These can be of any capacity or generation, have any size of SSD, HDD or controller!

Note: This does NOT mean we are clustering arrays together - we do not need a special backend cluster fabric to handle array data which you may have seen with out vendors implementation of scale-out or cluster-mode. We also do not require downtime or any swing-kit to move data off an array to enable this new feature.

The new "Arrays/Groups" section of the Nimble GUI
Scale-Out is the last piece of the Nimble Scale-to-Fit strategy, meaning customers who started with a single 3u, 500w array can now add more capacity (an additional 96TB usable using 3TB drives), add bigger MLC SSD drives for bigger cache working sets (up to 2.4TB usable), add bigger controllers to take their array from 20K IOPS to 70K IOPS, and now add additional Nimble arrays for a single management point & more performance, capacity and scale!


Nimble OS 2.0 is currently in Release Candidate stage and is available for customers to upgrade via Support. The code & technology is fully production-ready and has been through extensive beta and QA testing. It is the same process to upgrade the firmware as previous updates; a software package is downloaded from Nimble Support then applied to the array controllers one at a time (so no downtime!). If you'd like to be a part of the RC rollout please contact Nimble Support for more information.


Alongside Scale-Out we are launching some new tools for VMware and Microsoft Windows platforms to simplify the overall integration of these solutions; stay tuned for my blog posts on these features!