Thursday 3 October 2013

Roll up, roll up! Nimble Storage & VMworld Europe - Oct 14 - 17.

It's about THAT time of the year again; VMworld Europe is only days away! (12 days exactly as I write this).


VMworld has always been a very important conference for me personally and professionally, and is one that I always try to attend. This year's event will be my SEVENTH show in four years (I have been lucky enough to be posted across to the US version a few times too!) and it's great to see the European show getting stronger every year. I believe this year will be the strongest one yet.

There are many things I enjoy about the conference - from meeting customers new and old, to catching up with colleagues from years gone by (it's always amusing to see who works for which vendor/parter each year). I'll also be spending some of my time in the actual conference centre this year, as I have the ability to attend more seminars and breakout sessions than previous years. A key point I've always believed in is to never stop learning and expanding knowledge on subjects, and VMworld is certainly the place to do that! On the flip side, I'm not looking forward to the dull pain in my feet come Thursday afternoon!

For Nimble Storage it's quite possibly the most important show of the year for us, as we have the opportunity to meet with current customers and new customers in a friendly atmosphere over three days. Virtualisation and/or VDI as a platform is possibly the number one key driver behind a customer's decision to implement Nimble Storage and as such we aim to give VMworld the respect and attention it deserves!

So, what are we planning for this year's show?


Firstly, myself and my colleague and all-round genius Devin Hamilton will be hosting and presenting a customer panel on Disaster Recovery strategy, experiences and lessons for virtualised environments. This is session BCO5431 and is taking place Tuesday October 15th at 11am local time. The direct link is here.

We have a pretty cool booth stand organised (number E513) and will be manning the booth with all sorts of super-smart techies. We'll be running on-demand demos of the following for your pleasure.

    • Introduction to Nimble Storage
    • Nimble Storage OS 2.0
    • VMware vSphere Integration & Automated Connection Manager (very cool!)
    • Microsoft Windows Connection Manager (also very cool!)
    • Microsoft SQL & Exchange integration & recovery
    • Nimble Storage Infosight (Support based on Data Analytics!)


We will be raffling A WEEKEND EXPERIENCE WITH A PORSCHE 911S!!! Yes, you read that right, we will be giving away a Porsche 911S to you, for free, for the whole weekend! How great is that? (I'm a little annoyed that employees can't enter...)


If you don't win the first prize, we'll also be raffling off other cool goodies such as Beats By Dre headphones. 

You've got to be "in it to win it" as we say in the UK - and you can enter ahead of time here, or enter at the booth.

Nimble Storage are also sponsoring the vRockstar party which is taking place at the Hard Rock Cafe on Sunday night before the show. Attendance is free (and so is the drink!). You can sign up here if you're in town, we'll be pleased to see you!

I'll be at the show all week from Monday through Thursday - so if you have 5 minutes please feel free to drop by booth E513 (or say hello to me in a session I may be attending - I'm going to learn just like you guys are!).

See you there!

Nick

Monday 30 September 2013

Using VMware I/O Analyser To Test Storage Performance

Today i've been experimenting with the VMware I/O Analyser as a useful tool to drive storage performance from a fairly even baseline of tests.

The tool essentially is an Ubuntu VM with IOMeter and a web front end (which is OK, but doesn't help much), wrapped up in a nice OVF package.

First step is to download the package, which is available from the VMware Flings website (http://labs.vmware.com/flings/io-analyzer).

Next we need to push the OVF into the environment. As this is the controller VM we are not wanting to monitor the backend performance stats of the VM itself, so it should NOT be published on the datastore that we wish to test. Instead, publish the VM onto a local datastore or another shared volume. This is mostly due to the workload being generated may saturate the disks, SAN controllers or network which could affect this VM and may be detrimental to your test and not provide a fair result. 

In my case "Nimble-IOAnalyser" was my local datastore, and VMFS-01 was my datastore to be tested:


Select a datastore which is NOT to be tested by the I/O Analyser for your OVF deployment.
VMware's best practice for deploying Virtual Machines is to deploy the disks using "Thick Provision, Eager Zero" as a profile, so go ahead and use that.


Once the VM has been deployed it's key to take a look at the settings and at the disks it's created. What you'll notice is that the test disk (Hard Disk 2) has been created with only 100MB as a size; which means 100% of the testing will reside in memory or in controller cache. This is something we need to avoid as it does not provide a fair and real-world result. This Hard Disk is also provisioned into the incorrect datastore by default.


The default testing drive needs to be deleted (Hard Disk 2)
Delete this disk and create a new one with at least 100GB as it's size. This disk should also be placed on the datastore for which you wish to test the performance of, and again use "Thick Provision, Eager Zero".


Once deployed, power the VM on. You should be greeted with the familiar VMware appliance screen. Change your timezone to what's relevant to you (GMT for me). You could also change the network settings here, but I left mine as DHCP as it's not really needed. Login to the VM with the default credentials of root/vmware to continue.

Note: we're not going to use the web client provided for this tool, as whilst it's ok it's not possible to change any of the default values in the I/O testing phase of this workload.


Once logged in you'll see an Ubuntu screen with a terminal window open. Right-Click on the desktop and open another (Terminals->xterm).

In the first terminal, you want to type "/usr/bin/dynamo". This starts the backend IOMeter worker and thread engine.

In the second window, type "wine /usr/bin/Iometer.exe". This will open the IOMeter application, and should tie into the dynamo engine started.

Note: ignore the comment underneath of "Fail to open kstat...", as long as you opened the engine before IOMeter it'll be OK.


From here onwards it's down to how you use IOMeter. There are lots of incorrect methods to using this tool to provide expected results, so here are my settings:

  • Two workers, both mapped to the new 100GB volume (sdb).
  • Maximum disk size of 200000000 sectors (translates to 95GB).
  • 32 Outstanding I/Os per target (if this is left to 1 the test is not adequately driving the storage array!).


  • A new workload policy is created for 4K blocks. 100% random workload, and 100% write. (100% write should ALWAYS be the very first workload to the volume, otherwise there is no data to actually read back which does not provide real-world results).
  • Align the I/Os to the block size of your volume to remove disk misalignment performance discrepancies. In my case it's 4K.
  • Assign this workload to each of your workers to ensure you're consistent with your tests.
Some people may ask why 100% random; if you wish to test for IOPS performance in your storage, random IO is the key to generate these statistics. If you wish to test network performance (rather than IOPS) then Sequential I/O should be used. You should NOT mix these workloads together as you will be given inconsistent and inconclusive results for both disk and network stats.


  • Before running the test ensure you set a ramp up period (I use 15 seconds) and set a standard run-time (I use 10 minutes). Ensure all your workers are selected.
  • Click the Green Flag to start the test!
I hope the above has been useful to you. Please feel free to run this test and let me know your stats in the comments box on this page, along with the make/model of your storage array - would be a fun survey!

PS - if you wish to see my results:


Wednesday 25 September 2013

Nimble Storage 2.0 Part 1 - Scale-To-Fit

This is the first in a series of blog posts focusing on the new Nimble OS 2.0 which has been made available in Release Candidate status to our customer & partner base.

Nimble Storage has hit a milestone in it's product development and feature set by hitting 2.0 of it's awarding winning Operating System based on the CASL file system (Cache Accelerated Sequential Layout). 2.0 introduces some nice features which i'll cover over a series of blog posts in the following weeks.

Scale-To-Fit - Nimble OS 1.4

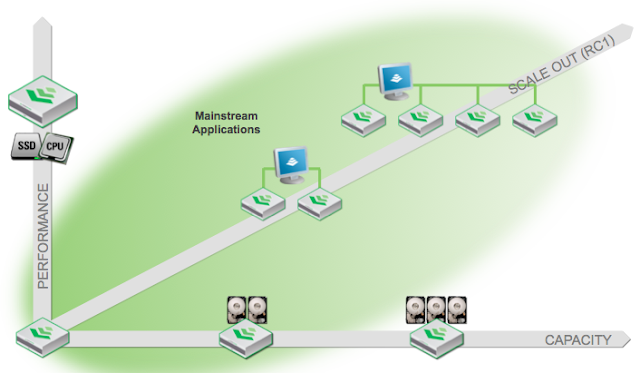
Approximately 12-14 months ago Nimble launched a concept of "Scale-To-Fit" storage technology. The idea being that traditional storage systems had limited ways for expansion once the customer had deployed the environment; these typically being:
  1. Add lots more slow disk for capacity or fast disk for performance (very common, not much risk involved).
  2. Forklift replace controller headers for new generation controllers to allow for further disk expansion (very expensive, high risk due to potential data downtime or loss, lots of Professional Services involved, rarely done).


Scale-To-Fit was designed to break this mould and give the customer a choice in how to upgrade their investment as their environment evolves. This was released in firmware version 1.4 of the Nimble OS, and allowed any Nimble customer to do the following:


  1. Add additional shelves of high-capacity drives for extra storage capacity.
  2. Add bigger SSD drives into the array to allow for bigger working sets for random-read cache.
  3. Upgrade Nimble controllers from CS200 to CS400 series to add more IOPS in the array.

All of the above upgrades were (and still are) designed to be performed online, without any maintenance windows or downtime of data - and it worked without any hiccups, which is very impressive (especially number 2 & 3 - see here for how our very first production customer with a 3 year old system did it this year: http://www.nimblestorage.com/blog/customers/non-disruptive-upgrade-to-nimble-storages-first-deployed-array/).

So what does 2.0 bring to Scale-To-Fit?

In Nimble OS 2.0 we complete the Scale-to-Fit strategy by bringing Scale-Out technology into the Nimble family!


Scale-Out is a technology which was mostly championed by EqualLogic (now Dell, my former employers) and Lefthand Networks (now HP) and is designed to allow customers to place multiple arrays into a "group" which allows volumes and/or datasets to be distributed, balanced and "live migrated" across different storage platforms without downtime. 

The downside to the two legacy technologies mentioned above was that scale-out is/was their only way of scaling. If a customer required just more capacity for their investment they had to buy a whole new array with controllers, networking and rack space just for a few more additional TB's of space - and these boxes were typically more expensive than their initial purchase due to less aggressive discounts offered (the age old sales ploy of discount high to win business then discount low to increase margin - seen it time and time again). One of my old EQL customers ended up with TWENTY THREE 3 or 5u arrays in their production site!

What Nimble offers is a full suite of scaling technologies without any gotchas; so if a customer just needs capacity they can buy additional shelves, but if they want to Scale-Out to group performance and capacity of their arrays together, they can do that too! All of this can be done live, without any downtime or any professional services work! Nice!

The beauty about scale-out is it does not limit customers to generations of gear; meaning that older arrays can be grouped together with newer, faster generations for seamless migration of data before evacuating the older array to repurpose for UAT, Disaster Recovery or other means (as one example).

On first release we are supporting up to FOUR Nimble arrays in a scale-out group. These can be of any capacity or generation, have any size of SSD, HDD or controller!

Note: This does NOT mean we are clustering arrays together - we do not need a special backend cluster fabric to handle array data which you may have seen with out vendors implementation of scale-out or cluster-mode. We also do not require downtime or any swing-kit to move data off an array to enable this new feature.

The new "Arrays/Groups" section of the Nimble GUI
Scale-Out is the last piece of the Nimble Scale-to-Fit strategy, meaning customers who started with a single 3u, 500w array can now add more capacity (an additional 96TB usable using 3TB drives), add bigger MLC SSD drives for bigger cache working sets (up to 2.4TB usable), add bigger controllers to take their array from 20K IOPS to 70K IOPS, and now add additional Nimble arrays for a single management point & more performance, capacity and scale!


Nimble OS 2.0 is currently in Release Candidate stage and is available for customers to upgrade via Support. The code & technology is fully production-ready and has been through extensive beta and QA testing. It is the same process to upgrade the firmware as previous updates; a software package is downloaded from Nimble Support then applied to the array controllers one at a time (so no downtime!). If you'd like to be a part of the RC rollout please contact Nimble Support for more information.


Alongside Scale-Out we are launching some new tools for VMware and Microsoft Windows platforms to simplify the overall integration of these solutions; stay tuned for my blog posts on these features!

Wednesday 14 August 2013

Cutting Through Storage Marketing & Spin

This is a very lengthy post; for that I apologise in advance! But this is something I feel very passionately about...

It's been a very rowdy few days in the world of Enterprise Storage and technology announcements! 

Typically July and August are very quiet times in IT mostly due to Summer Holidays/Vacations inside IT departments, resellers, ISVs and vendors alike (certain countries in mainland Europe even go so far as to shut down completely for 4-6 weeks during this time!). 

However this year something strange has happened; a wave of mystical product launches, PR statements and marketing/blogpost overdrive has been visible from lots of the start-up or hyper-growth storage companies eyeing your business and storage projects.

The theme seems to be consistent across the board; 
  1. We are far cheaper than everyone else
  2. We bring MILLIONZ more IOPS/performance than everyone else
  3. Why would you buy anything else, when we're around?

From reading these PR statements and blog posts from multiple vendors it suddenly dawned on me that if I was slightly bemused by the statements, how on earth would potential customers and partners be able to differentiate and sift through the marketing statements to relate the product to their environment or requirements?

So, without further ado - here are some of my top tips to help navigate through the realms of marketing claims for end-user environments:

1. Ensure your requirements & needs are documented and ranked in importance from 1-10.


When I meet customers they typically have an immediate need for a prospective storage solution (i.e. storage for VMware vSphere and Microsoft SQL, for example). However other nice-to-have requirements may be to use application consistent snapshots for backups, or replication for disaster recovery, but perhaps a feature such as NAS connectivity is not something on the agenda right now.

Recently there are a few products coming to the table with products that literally have EVERY feature you could ever want or think of with no additional cost. Whilst this sounds great on the datasheet, in the PR statement or blogposts, often these solutions have a poor implementation of these features as development may not allow for deep engineering and full Quality Assurance testing. It truly is the idea of perhaps offering too much (and thus rarely excelling at not a lot).

By ranking by importance your requirements and features you need in a prospective solution it will allow you to move on to number 2:

2. Always trial, test (and score!) your prospective vendors before you make a purchase decision.


Once you've been able to rank your requirements and feature sets, this then allows you to form your testing criteria for any Proof of Concept evaluation you decide to run.

Time and time again I'm asked to run vendor bake-offs / POCs against competitors, but the end-user has not been able to draw up any set pass/fail criteria for the bake-off testing; opting to trust the vendor with their generic (and more often bias) test plan and criteria for any POC testing.

This is a very dangerous situation as it allows the hardware/software provider to shape and manipulate your tests to suit their best features whilst hiding all problematic or half-baked feature sets which may be a show-stopper if it were to be exposed.

Being able to rank and understand requirements from a potential storage environment upfront will allow the creation of a non-bias POC test-plan document when the time comes, which ultimately ensures that the test is 100% fair, and does not allow any vendor to influence and manipulate said testing in a way that they are almost guaranteed to win hands-down in most tests.

This also allows you to move on to number 3:

3. Never, EVER 100% trust performance tests run by vendors - run your own!


When running performance bake-offs every vendor will be cunning with how the performance test is derived. 

Most typically a tool such as IOMeter or SQLIO will be used to demonstrate performance of the product as the first thing after the storage array is installed in the environment. Whilst these tools are great (and will almost always report great results) it's often run when the array has NO data on it whatsoever, so the array is 100% optimised to deliver the best possible result as a performance test (for example, ZFS based arrays will dramatically degrade in performance once data capacity starts to be used but will show mind-blowing IO results when empty).

Another thing to consider is that a production environment will require a mixture of IO block sizes for various applications, whilst IO profiles (reads or writes, random or sequential) are often a variable mix every single day. It's a true cliche, but there's something called the IO Blender (especially with virtualised workloads) where one cannot guarantee whether the environment may drive random or sequential reads or writes, and the profile of the IO may change without warning. 

99% of all storage array vendors will NOT take the above into account as part of a POC, opting to show purely random reads or writes using small (4k) blocks as a single request to the array to give the best result. 

So it's very important to mandate that you run performance tests with YOUR data and yours alone. This ensures that you can understand the performance of the test today (on a current solution) and would be able to quantify the increase/decrease in performance once it's on a new solution. This is a far better test than being shown an IOMeter screen pushing 100,000 IOPS and running 20,000 more than the competitor's box.

4. Flash storage for $/GB less than Spinning Disk? Yeah Right.


Another interesting statistic that's been observed recently from some of the All Flash Array (AFA) vendors is the claim of having lower cost per Gigabyte ($/GB) than spinning disk media.

Everyone knows one day the above will be true, however i'm afraid right now this statement is another pure-marketing claim.

When digging more into this claim i've noticed that these claims are only true when taking into account large compression and de-duplication savings of the data set vs uncompressed & un-deduplicated data on the spinning media. 

This is a) assuming that the current spinning disk array does not have any compression or de-dupe running on it today, but more naively b) assumes that the dataset is highly compressible and would be susceptible to large de-reduplication reductions - which a large amount of production environments are not.

For example; I recently encountered the above claim in a recent POC bake-off between a series of storage vendors. The customer had their head turned by the claims of major cost reduction savings of an All-Flash Array, promising that it would be the same cost (or even less than) the spinning disk or hybrid storage guys. However the customer was wise in their POC criteria; who mandated they would copy THEIR production data and working set to the array and determine exactly the saving in primary space we will see for de-dupe and compression on the array. 

It was observed that whilst the AFA vendor promised reductions of 6-10:1, the real-world testing only delivered 2-3:1 reduction of data (with compression bringing almost 2x more reduction in space than the de-dupe on the system, which is not uncommon to see) - meaning the end result was savings were not near the marketing claims and thus being almost 2x more expensive than the competition.

Storage array vendors call the reduction in primary data needs as "Effective Capacity", and are starting to size solutions based on these figures. Whilst it sounds great in a presentation (who wouldn't want to get 300TB from 30TB of disk!?) it's very often the case that in true environments the figures are wildly off.

The moral of this point is simple; Never, EVER size to Effective Capacity (regardless of what your storage array vendor tells you) as it's never a guaranteed figure that you'll get. And so ALWAYS use Usable Capacity, and any primary storage reductions seen from compression and/or de-duplication is an additional bonus. 

I feel there could be a future blog post in this topic...

I hope some of the above tips are useful and have provided food for thought. I have more recommendations on how to navigate through the minefields of Enterprise storage today, but hopefully the above is a good starting point.